How to Read Your Solar Monitoring App: Spot Underperformance Before It Costs You
Learn how to use a solar monitoring app in Australia to check output, exports, self-consumption and faults before they cost you.
 Randy Osifo-Doe
A solar monitoring app Australia homeowners can actually use should show generation, imports, exports, self-consumption and faults. Check it monthly, compare it with your bill, and act fast if output drops, exports vanish or fault codes appear.
Your app is not just a nice dashboard. It is the quickest way to see whether your solar system is saving money or quietly underperforming.
Why your solar monitoring app matters after installation
What a solar monitoring app shows in plain English
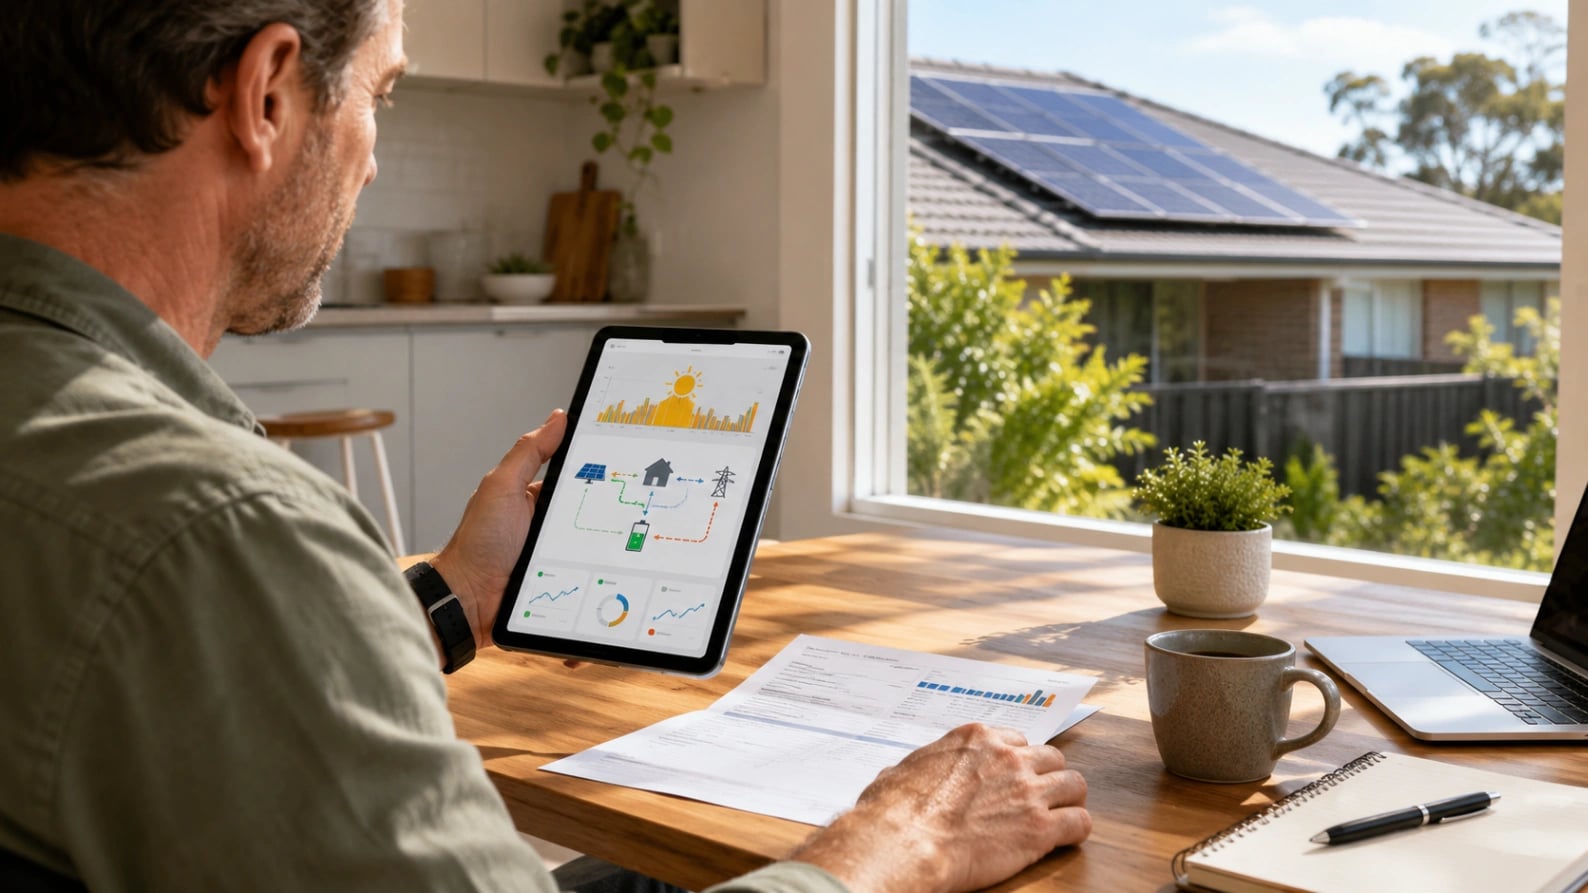
Most apps show how much solar your panels made, how much your home used, what you imported from the grid, and what you exported. If you have a battery, the app should also show charge, discharge and backup status.
Some basic inverter apps only show solar generation. That is useful, but incomplete. Without consumption monitoring, you cannot clearly see how much solar you used on site.
Why checking performance monthly can protect your payback
Solar payback depends on years of steady output. A tripped breaker, failed inverter channel, shading change or Wi-Fi fault can go unnoticed for months.
In my reviews of household bills, the expensive problems are often boring ones: the system is working, but not working well.
Australian context: high rooftop solar uptake and changing export rules
The Clean Energy Regulator tracks millions of small-scale rooftop solar installations across Australia. AEMO has also reported that distributed solar is now a major factor in grid operation.
That means exports are no longer “set and forget”. In some areas, dynamic export limits and network rules affect what your system can send to the grid. For more detail, see our guide to dynamic solar export limits and Wi-Fi.
The key numbers to check in your solar monitoring app
Solar production: how many kWh your panels generated
Solar production is measured in kilowatt-hours, or kWh. This is the amount of energy made over time.
Kilowatts, or kW, are different. kW is the power at one moment. kWh is what you pay for on your bill.
| App number | What it means | Why it matters |
|---|---|---|
| Solar generation | kWh made by panels | Shows system output |
| Home consumption | kWh used by your property | Shows demand patterns |
| Grid imports | kWh bought from grid | Drives your bill cost |
| Grid exports | kWh sent to grid | Creates feed-in credits |
| Self-consumption | Solar used on site | Often drives the best savings |
Grid imports, exports and self-consumption
High generation does not always mean high savings. If most of your solar is exported at a low feed-in tariff, your payback may be slower.
Using solar in your home can be worth more than exporting it, depending on your retail rate and feed-in tariff. Check current offers with our feed-in tariffs by state tool.
What ‘normal’ solar performance looks like in Australia
Why output changes by season, location and roof direction
Solar output changes with season, suburb, roof pitch and panel direction. Winter output is usually lower, especially in southern states.
North-facing panels often peak around the middle of the day. East-west systems spread output across morning and afternoon. Our guide to east-west vs north-facing solar panels explains the trade-off.
Cloud, heat and smoke: common causes of daily dips
Cloud, storms, smoke haze and dirt can all reduce output. Hot panels also produce less power than cool panels in bright sun.
Do not judge your system from one bad day. Compare weekly, monthly and yearly trends.
Why a 6.6 kW system will not always show 6.6 kW output
A 6.6 kW solar system is rated under laboratory test conditions. Real roofs are hotter, dirtier and less perfect.
Many Australian homes also pair 6.6 kW of panels with a 5 kW inverter. Seeing a peak below panel size is often normal.
How to spot solar underperformance early
A sudden drop in daily generation
A sharp fall on clear days can point to shading, a tripped isolator, dirty panels, inverter issues or failed optimisers.
Compare the same day type, not a sunny Monday with a stormy Tuesday.
One string or inverter channel producing less than expected
If your app shows string or MPPT data, check whether one side is much lower than usual. This can show a panel, wiring or shading problem.
Panel-level monitoring can be even clearer, but not every system has it.
No data showing in the app
No data is not always a solar fault. It may be a Wi-Fi dropout, new router, changed password or server issue.
First check whether the inverter lights look normal. Then reconnect Wi-Fi through the app or installer portal.
Frequent inverter shutdowns or fault codes
Repeated shutdowns, red lights or fault messages need attention. Save screenshots before the code disappears.
Never open inverter or switchboard covers yourself.
Exports disappearing even when the sun is strong
If generation is normal but exports are missing, check whether your home is using the solar first. If not, the issue may be a meter, export limit or network setting.
How to compare your app data with your electricity bill
Matching billing periods with app date ranges
Set your app to the exact bill dates. A calendar month rarely matches a retailer billing period.
Checking imported and exported kWh
Your bill is usually the source of truth for charged imports and credited exports. Your app is best for trends and troubleshooting.
Small differences are normal. Inverter data, consumption clamps, smart meters and retailer systems measure from different points.
If your bill looks wrong, compare your plan type too. Our guide to flat rate vs time-of-use vs demand tariffs can help.
Using your app to improve solar savings
Move flexible loads into the solar window
Use the app to find your strongest solar hours. For many homes, that is late morning to mid-afternoon.
Run dishwashers, washing machines, dryers, pool pumps and heat pump hot water during that window where safe and practical. See our guide to shifting pool pumps and hot water into the middle of the day.
Watch peak-rate imports in the evening
Even with strong solar, evening imports can be costly. Your app can show whether dinner, air conditioning or EV charging is driving peak usage.
Use battery data to check behaviour
A battery monitoring app should show charging from solar, discharging at night and reserve levels. If it sits full all day or empty too early, settings may need review.
Use our Battery Calculator before upsizing or adding storage.
Common solar monitoring app mistakes to avoid
Judging performance from one day of data
One cloudy day proves little. Look for patterns over weeks.
Ignoring consumption monitoring
Generation-only monitoring misses the biggest savings lever: self-consumption.
Forgetting to reconnect Wi-Fi
After changing your router, check the inverter connection. The system may still make power, but the app may stop updating.
Assuming a green icon means maximum savings
“Online” does not mean optimised. You still need to check imports, exports and usage timing.
Not saving screenshots before a warranty claim
Keep screenshots of fault codes, low-output days and app graphs. They help your installer diagnose the issue.
What to ask your installer before choosing a solar monitoring app
Does the quote include consumption monitoring?
Ask this before signing. It may need extra hardware in your switchboard.
Will I get live data or delayed data?
Some apps update in seconds. Others lag by hours.
Who receives fault alerts?
Ask whether alerts go only to you, or also to the installer.
Is the app free or subscription-based?
Check app costs, warranty support and data access before installation.
Can the data be exported?
Exportable data is useful for hard faults, bill disputes and performance checks.
When to call your installer or a licensed electrician
Safety warning
Do not open inverter, isolator or switchboard covers. In Australia, electrical work must be done by licensed people.
What evidence to send
Send screenshots, dates, fault codes, photos of warning lights and recent bills. Clear evidence speeds up warranty support.
Faults that need urgent attention
Call promptly for burning smells, water ingress, repeated shutdowns, visible damage or electrical warnings.
Quick monthly solar app checklist
- Check monthly generation against the same month last year.
- Review imports, exports and self-consumption.
- Look for alerts, fault codes or missing data.
- Check battery charge and discharge if installed.
- Compare bill feed-in credits with app exports.
- Reconnect Wi-Fi after router changes.
- Save screenshots before contacting support.
FAQ
What should I look for in a solar monitoring app in Australia?
Look for solar generation, home consumption, grid imports, grid exports, battery status, fault alerts and easy date comparisons.
Why does my solar app show less output than my system size?
System size is the panel rating under test conditions. Real output changes with heat, cloud, shading, sun angle and inverter limits.
Is my solar app or electricity bill more accurate?
Your bill is usually the source of truth for charged imports and credited exports. Your app is best for performance trends.
How often should I check my solar monitoring app?
A quick monthly check is enough for most homes. Check sooner after storms, high bills, router changes or inverter alerts.
Do I need consumption monitoring with my solar system?
Yes, if you want a true view of savings. Without it, you may see generation but not self-consumption, imports or exports.
Last reviewed May 2026
This guide is reviewed against current Australian solar policy and market guidance where available. Confirm retailer prices, rebates, and product eligibility before making a purchase decision.
Randy Osifo-Doe
Randy is the founder and the lead writer behind Aussie Solar Guide, an independent resource helping Australian homeowners navigate solar, batteries, and home energy without the sales pitch. His background is in finance, banking and renewable energy. He thinks in household budgets and real-world trade-offs, not kilowatts and spec sheets. He writes from Brisbane, covering the Australian energy market as it actually is in 2026, not how installers pitch it.